Success graph of the flat earth society against NASA, considering the numbers in the google trendsGoogle trends shows us the general tendency of the people.
It doesn't publish the tendency by years, but we may calculate it by estimate as follow:
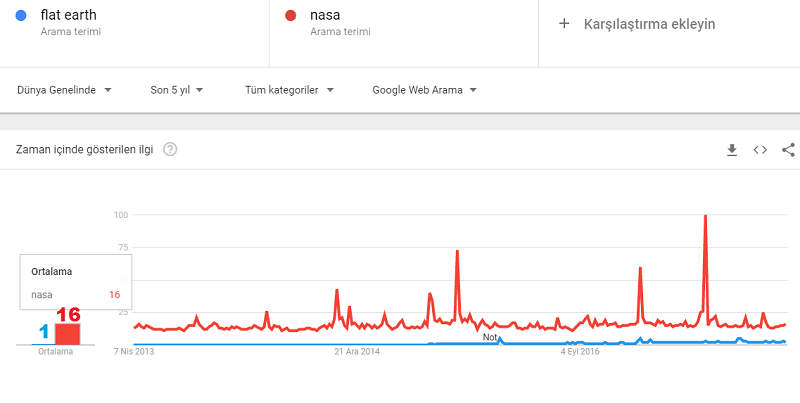
Comparing the trends for "last 5 year", "last year", "last 3 months", "last month" and "last week".
NASA/FE interests in:
Last 5 years: 16/1=16
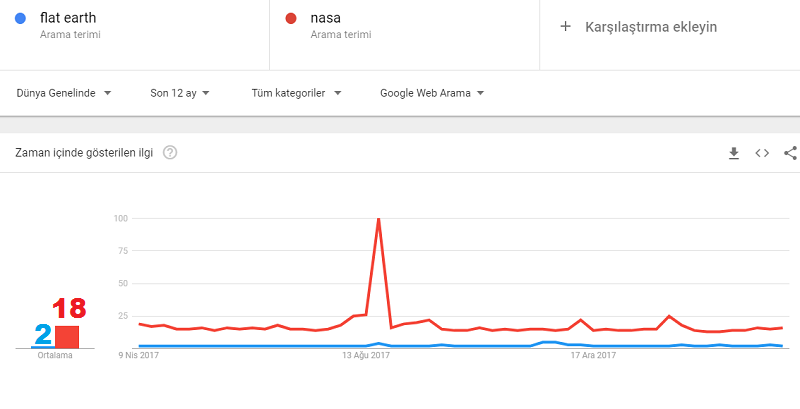
Last 1 year: 18/2 = 9
Last day: 36/6 = 6
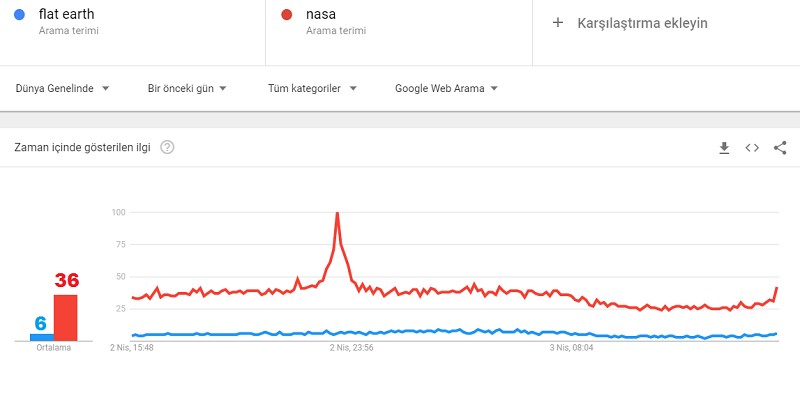
Now. We see the general tendency of the Flat earth is arrived at 1/6. It was about 1/7 in 3 months ago. In 3 months, the interest to the FE theory increased about 17%.
Now. Lets try to draw a graph of show us general increase rate of the flat earth belief.
For this, we must extract the recent values from old ones. We'll not examine it and use basic methods:
Today:6
Last year: 9
So>> 1 year ago: 12
1 year ago: 12
Last 5 years: 16
So>> 5 years ago: 20 (year 2013)
So>> 4 years ago: 18 (year 2014)
So>> 3 years ago: 16 (year 2015)
So>> 2 years ago: 14 (year 2016)
So>> 1 year ago : 12 (year 2017)
Now we may draw the graph as follow:
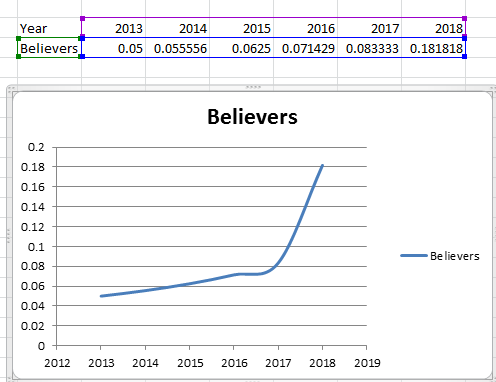
We may define the point of intersection as an estimate as follow (the 1 value of the graph)
This can be taken as a 2nd parabol by considering start, one of middle and the end points:
(2013; 0,05)
(2015; 0,0625)
(2018; 0,1818)
So;
( ?.. ; 1,00)
Y= aX²+ BX+c
2013= a(0,05)²+b(0,05)+C
2015=a(0,0625)²+b(0,0625)+C
2018=a(0,1818)²+b(0,1818)+C
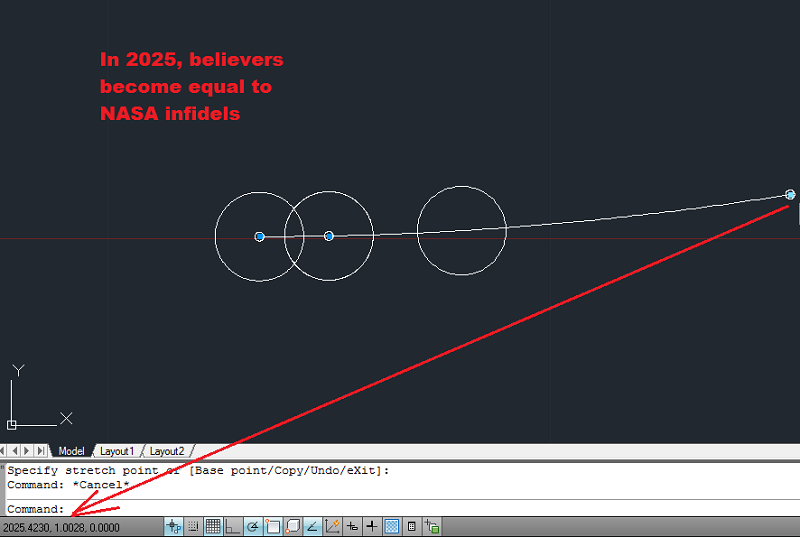
In 2025, number of believers become equal to infidels of NASA. This is later from my estimation was about 2020-2021. Sad. We should do something to improve the process.