sandokahn's gravity-effect-on-air theory

  • 250 Replies
  • 84494 Views
*

Son of Orospu

  • Jura's b*tch and proud of it!
  • Planar Moderator
  • 37834
  • I have artificial intelligence
Re: sandokahn's gravity-effect-on-air theory
« Reply #60 on: September 19, 2013, 01:22:07 AM »
You are confusing muddy water with sandy water.  Sandy water would settle out.  Mud has organic material in it that is likely less dense than water and therefore tends to just float around.

Just my guess, though. 

?

Scintific Method

  • 1448
  • Trust, but verify.
Re: sandokahn's gravity-effect-on-air theory
« Reply #61 on: September 19, 2013, 02:27:01 AM »
You are confusing muddy water with sandy water.  Sandy water would settle out.  Mud has organic material in it that is likely less dense than water and therefore tends to just float around.

Just my guess, though.

Perhaps, but then why wouldn't the less dense organic material just rise to the top? It's the same problem, just reversed.
Quote from: jtelroy
...the FE'ers still found a way to deny it. Not with counter arguments. Not with proof of any kind. By simply denying it.

"Better to keep your mouth shut and be thought a fool, than to open it and remove all doubt."

*

Son of Orospu

  • Jura's b*tch and proud of it!
  • Planar Moderator
  • 37834
  • I have artificial intelligence
Re: sandokahn's gravity-effect-on-air theory
« Reply #62 on: September 19, 2013, 02:31:05 AM »
Probably some of it is neutrally buoyant.  So, some floats to the top, some hangs around the middle, and some sinks to the bottom. 

Re: sandokahn's gravity-effect-on-air theory
« Reply #63 on: September 19, 2013, 03:00:06 AM »
In simple terms, water vapour rises to the air because it is lighter than air. Once it reaches an altitude of condensation level, it forms droplets. Droplets are kept in the air by updraft (vertical movement of air) the same way as hang gliders are lifted in the air. Without updraft, the cloud dissipates or doesn't form.

I think, therefore I am

*

sandokhan

  • Flat Earth Sultan
  • Flat Earth Scientist
  • 7138
Re: sandokahn's gravity-effect-on-air theory
« Reply #64 on: September 19, 2013, 06:24:39 AM »
Cartesian, I already responded re: water vapour, updrafts...you have not addressed ANY of the precise points I made there...your official copypasta amounts to nothing and is totally debunked here:

http://www.theflatearthsociety.org/forum/index.php/topic,59837.msg1542538.html#msg1542538

Clouds can have a height ranging from 50 meters to over 5 km, and a length ranging from 100 meters to 1000 km; a cumulus cloud, 1 kilometer in diameter, will weigh 5 MILLION TONS, or about the weight of 1 million cars. A cumulonimbus cloud, 5 kilometers in height, and having a diameter of 15 kilometers, will actually weigh 1 BILLION TONS.


No atmospheric current speed could account at all for these types of cloud weights: 5 million tons,  or 1 billion tons.

Remember, that the currents stop frequently, changing their position/direction often: therefore, the situation is even more hopeless for the official atmospheric science explanations (the ridiculous updraft explanation).


monkey...please do some research before posting in the upper forums.

It is embarrassing to write something like this:

You do realize that the difference in weight between Oxygen gas and Nitrogen gas is only two protons and a few neutrons, right?  Gravity is an extremely weak force so it isn't able to overcome the Brownian - diffusion caused by the energy present in the air because of things like solar radiation and ambient temperature.


Let us access the OFFICIAL TEXTBOOK used by the RE:

In fact, at an altitude of 400 kilometres (250 mi), equivalent to a typical orbit of the Space Shuttle, gravity is still nearly 90% as strong as at the Earth's surface.


Do you understand what attractive gravity implies?

The ingredients of the air—oxygen, nitrogen, argon and other gases—though not in a compound but in a mixture, are found in equal proportions at various levels of the atmosphere despite great differences in specific weights. The explanation accepted in science is this: “Swift winds keep the gases thoroughly mixed, so that except for water-vapor the composition of the atmosphere is the same throughout the troposphere to a high degree of approximation.” This explanation cannot be true. If it were true, then the moment the wind subsides, the nitrogen should stream upward, and the oxygen should drop, preceded by the argon. If winds are caused by a difference in weight between warm and cold air, the difference in weight between heavy gases high in the atmosphere and light gases at the lower levels should create storms, which would subside only after they had carried each gas to its natural place in accordance with its gravity or specific weight. But nothing of the kind happens.

When some aviators expressed the belief that “pockets of noxious gas” are in the air, the scientists replied:

“There are no ‘pockets of noxious gas.’ No single gas, and no other likely mixture of gases, has, at ordinary temperatures and pressures, the same density as atmospheric air. Therefore, a pocket of foreign gas in that atmosphere would almost certainly either bob up like a balloon, or sink like a stone in water.”

(antonio, the reference for the pockets of noxious gas is this: W.J. Humphreys, Physics of the Air, 1940, p.227 - Atmospheric Circulation, Winds Adverse to Aviation chapter)

As I said, those values cannot help your case at all: updrafts can be debunked immediately. Your requests are way beyond the scope of our discussion, an unnecessary diversion on your part which does not work with me. If you are really interested in this subject, please do the research yourself: remember, you have to prove that the updraft (upward moving air) LASTS FOR THE ENTIRE RECORDED TRAJECTORY OF THE CUMULONIMBUS CLOUD, 5 kilometers in height, and having a diameter of 15 kilometers, WEIGHING 1 BILLION TONS.

Reread the Cloud Trajectories Paradox: there is no way you can explain the restoring forces paradox.

As for your video (a very interesting cloud formation pattern), you must understand the cyclone/anticyclone paradox, which no heliocentrist (like yourself) can explain:

Cyclones, characterized by low pressure and by winds blowing toward their centers, move counterclockwise in the northern hemisphere and clockwise in the southern hemisphere. This movement of air currents in cyclonic vortices is generally explained as the effect of the earth’s rotation.

Anticyclones, characterized by high pressure and by winds blowing from their centers move clockwise in the northern hemisphere and counterclockwise in the southern hemisphere. The movement of anticyclones has not been explained and is regarded as enigmatic.

Cyclones and anticyclones are considered a problem of fluidal motion with highest or lowest pressure in the center. As the movement of anticyclones cannot be explained by the mechanistic principles of gravitation and rotation, it must be concluded that the rotation of cyclones is also unexplained.


Remember the effect of the torsion of the telluric currents (ether) on the ring laser gyroscopes and much more...


The barometer pressure paradox defies any RE explanation: a clear and absolute proof that the atmosphere does not obey any kind of attractive gravity.

http://www.theflatearthsociety.org/forum/index.php/topic,59837.msg1542538.html#msg1542538 (the difference between mean sea level measurements and absolute barometer pressure measurements)

“It has been known now for two and a half centuries, that there are more or less daily variations in the height of the barometer, culminating in two maxima and two minima during the course of 24 hours. The same observation has been made and puzzled over at every station at which pressure records were kept and studied, but without success in finding for it the complete physical explanation. In speaking of the diurnal and semidiurnal variations of the barometer, Lord Rayleigh says: ‘The relative magnitude of the latter [semidiurnal variations], as observed at most parts of the earth’s surface, is still a mystery, all the attempted explanations being illusory.’”


One maximum is at 10 a.m., the other at 10 p.m.; the two minima are at 4 a.m. and 4 p.m. The heating effect of the sun can explain neither the time when the maxima appear nor the time of the minima of these semidiurnal variations. If the pressure becomes lower without the air becoming lighter through a lateral expansion due to heat, this must mean that the same mass of air gravitates with changing force at different hours.
« Last Edit: September 19, 2013, 06:32:53 AM by sandokhan »

?

rottingroom

  • 4785
  • Around the world.
Re: sandokahn's gravity-effect-on-air theory
« Reply #65 on: September 19, 2013, 06:36:53 AM »
Sandokhan I have shown you observations that contradict your statements about semi diurnal pressure variations. Please stop.

*

sandokhan

  • Flat Earth Sultan
  • Flat Earth Scientist
  • 7138
Re: sandokahn's gravity-effect-on-air theory
« Reply #66 on: September 19, 2013, 06:51:55 AM »
Your observations are catastrophically wrong.

YOU DO NOT UNDERSTAND THE DIFFERENCE BETWEEN MEAN SEA LEVEL OBSERVATIONS AND TRUE BAROMETER PRESSURE MEASUREMENTS.

HERE WE GO AGAIN.

Your stubborness is caused by your unwillingness to accept the definite proofs, AND NOT BY SCIENCE.

Here is what you wrote earlier, the same kind of complaint:

Do you realize that the link you provided points out other observations that are not at exactly 4am, 4pm, 10am and 10pm?

You haven't done your homework, just as usual.

How to properly calculate absolute barometer pressure measurements:

http://adsabs.harvard.edu/full/1969SSRv...10....3L

Remember, that your links provide information about the sea level and mean sea level pressure measurements.

This is much easier to perform than the actual absolute barometer pressure calculation.


NATIONAL WEATHER SERVICE official information

The most basic change in pressure is the twice daily rise and fall in due to the heating from the sun. Each day, around 4 a.m./p.m. the pressure is at its lowest and near its peak around 10 a.m./p.m. The magnitude of the daily cycle is greatest near the equator decreasing toward the poles.

http://oceanservice.noaa.gov/education/yos/resource/JetStream/atmos/pressure.htm

THIS HAPPENS EACH AND EVERY DAY, EVERYWHERE.

Can you understand this much?

Each day, around 4 a.m./p.m. the pressure is at its lowest and near its peak around 10 a.m./p.m.


That this is actually the case can be readily deduced from the very links you provided.

http://weather.noaa.gov/weather/current/RCSS.html

Take a look at the ARTIFICIAL NATURE OF THE DATA AT THE PRESSURE INCHES COLUMN.

MUCH OF THE SAME NUMBERS, REPEATED: 29.77 - 29.80 - 29.83 - 29.85

This means that we are dealing WITH SEA LEVEL PRESSURE CALCULATIONS, which, as I have said, are much easier to perform than actual absolute barometer measurements.

HERE IS THE REAL DATA ON TAIWAN:

http://www-das.uwyo.edu/~geerts/cwx/notes/chap01/diurnal.html

Surface pressure measurements in Taiwan (at 25 deg. N) are least around 4am and (especially) 4 pm Local Standard Time, and most around (especially) 10am, and 10pm LST; the amplitude of the semidiurnal cycle is about 1.4 hPa.

My links provide the correct information about the maximums and minimums of the barometric pressure readings, as always.


THE SAME ARTIFICIAL NUMBERS USED IN THE CORONADO LINK YOU PROVIDED.

http://www.wrh.noaa.gov/mesowest/getobext.php?wfo=sgx&sid=KNZY&num=72&raw=0

Station pressure: 29.764 - 29.774 - 29.754 - 29.744 ; also there is precise correlation between the SEA LEVEL PRESSURE data and the Station Pressure data: this only means that the sea level pressure and mean sea level pressure data was used AND NOT THE REAL ABSOLUTE BAROMETER MEASUREMENTS.


OFFICIAL ATMOSPHERIC SCIENCE INFORMATION:

The mean sea level pressure (MSLP) is the atmospheric pressure at sea level or (when measured at a given elevation on land) the station pressure reduced to sea level assuming that the temperature falls at a lapse rate of 6.5 K per km in the fictive layer of air between the station and sea level.
This is the atmospheric pressure normally given in weather reports on radio, television, and newspapers or on the Internet. When barometers in the home are set to match the local weather reports, they measure pressure reduced to sea level, not the actual local atmospheric pressure. The reduction to sea level means that the normal range of fluctuations in atmospheric pressure is the same for everyone.

THIS IS THE INFORMATION CONTAINED IN YOUR LINKS, NOT THE ACTUAL BAROMETER PRESSURE MEASUREMENTS.

THIS IS THE REASON FOR THE ARTIFICIAL NATURE OF THE NUMBERS IN THE SEA LEVEL PRESSURE AND STATION PRESSURE DATA.


But what else could we expect from you? You come here without any idea of what is going on, not realizing the precise difference between sea level/mean sea level pressure measurements and ACTUAL ABSOLUTE BAROMETER MEASUREMENTS.

If the work is properly done, then this is what you will get:

http://books.google.ro/books?id=vNkZAQAAIAAJ&pg=RA1-PA217&lpg=RA1-PA217&dq=barometer+pressure+semidiurnal+change+10+am+4+pm&source=bl&ots=zgQHfJMC_w&sig=NMbmgLuqwPVwEfGVp3WuSu8Mdgg&hl=ro&sa=X&ei=-As4UqWRL4qp4ATI2ICIBA&ved=0CEAQ6AEwAQ#v=onepage&q=barometer%20pressure%20semidiurnal%20change%2010%20am%204%20pm&f=false

THIS IS REAL SCIENCE: DAILY SEMIDIURNAL CHANGES IN THE BAROMETER PRESSURE READING.

Maximums at 10:00 am and 10:00 pm, and minimums at 4:00 am and 4:00 pm.


I ask you again, do you understand English?

“It has been known now for two and a half centuries, that there are more or less daily variations in the height of the barometer, culminating in two maxima and two minima during the course of 24 hours. The same observation has been made and puzzled over at every station at which pressure records were kept and studied, but without success in finding for it the complete physical explanation. In speaking of the diurnal and semidiurnal variations of the barometer, Lord Rayleigh says: ‘The relative magnitude of the latter [semidiurnal variations], as observed at most parts of the earth’s surface, is still a mystery, all the attempted explanations being illusory.’”


One maximum is at 10 a.m., the other at 10 p.m.; the two minima are at 4 a.m. and 4 p.m. The heating effect of the sun can explain neither the time when the maxima appear nor the time of the minima of these semidiurnal variations. If the pressure becomes lower without the air becoming lighter through a lateral expansion due to heat, this must mean that the same mass of air gravitates with changing force at different hours.


End of discussion. The daily semidiurnal changes in the barometric pressure readings, CANNOT BE EXPLAINED AT ALL:  If the pressure becomes lower without the air becoming lighter through a lateral expansion due to heat, this must mean that the same mass of air gravitates with changing force at different hours.


I ask you again, do you understand English?

http://weather.noaa.gov/weather/current/RCSS.html

Take a look at the ARTIFICIAL NATURE OF THE DATA AT THE PRESSURE INCHES COLUMN.

MUCH OF THE SAME NUMBERS, REPEATED: 29.77 - 29.80 - 29.83 - 29.85

This means that we are dealing WITH SEA LEVEL PRESSURE CALCULATIONS, which, as I have said, are much easier to perform than actual absolute barometer measurements.

HERE IS THE REAL DATA ON TAIWAN:

http://www-das.uwyo.edu/~geerts/cwx/notes/chap01/diurnal.html

Surface pressure measurements in Taiwan (at 25 deg. N) are least around 4am and (especially) 4 pm Local Standard Time, and most around (especially) 10am, and 10pm LST; the amplitude of the semidiurnal cycle is about 1.4 hPa.

My links provide the correct information about the maximums and minimums of the barometric pressure readings, as always.


THE SAME ARTIFICIAL NUMBERS USED IN THE CORONADO LINK YOU PROVIDED.

http://www.wrh.noaa.gov/mesowest/getobext.php?wfo=sgx&sid=KNZY&num=72&raw=0

Station pressure: 29.764 - 29.774 - 29.754 - 29.744 ; also there is precise correlation between the SEA LEVEL PRESSURE data and the Station Pressure data: this only means that the sea level pressure and mean sea level pressure data was used AND NOT THE REAL ABSOLUTE BAROMETER MEASUREMENTS.


OFFICIAL ATMOSPHERIC SCIENCE INFORMATION:

The mean sea level pressure (MSLP) is the atmospheric pressure at sea level or (when measured at a given elevation on land) the station pressure reduced to sea level assuming that the temperature falls at a lapse rate of 6.5 K per km in the fictive layer of air between the station and sea level.
This is the atmospheric pressure normally given in weather reports on radio, television, and newspapers or on the Internet. When barometers in the home are set to match the local weather reports, they measure pressure reduced to sea level, not the actual local atmospheric pressure. The reduction to sea level means that the normal range of fluctuations in atmospheric pressure is the same for everyone.

THIS IS THE INFORMATION CONTAINED IN YOUR LINKS, NOT THE ACTUAL BAROMETER PRESSURE MEASUREMENTS.

THIS IS THE REASON FOR THE ARTIFICIAL NATURE OF THE NUMBERS IN THE SEA LEVEL PRESSURE AND STATION PRESSURE DATA.


You are trying to DENY THE OBSERVATIONS MADE FOR THE PAST TWO HUNDRED YEARS.

You are trying to deny the quote from the National Weather Service:

NATIONAL WEATHER SERVICE official information

The most basic change in pressure is the twice daily rise and fall in due to the heating from the sun. Each day, around 4 a.m./p.m. the pressure is at its lowest and near its peak around 10 a.m./p.m. The magnitude of the daily cycle is greatest near the equator decreasing toward the poles.

http://oceanservice.noaa.gov/education/yos/resource/JetStream/atmos/pressure.htm

THIS HAPPENS EACH AND EVERY DAY, EVERYWHERE.

Can you understand this much?

Each day, around 4 a.m./p.m. the pressure is at its lowest and near its peak around 10 a.m./p.m.


Your links and pseudoexplanations have BEEN THOROUGHLY TRASHED AND DEBUNKED.

You have nothing left here, but to accept the truth.

Here it is for you.

One maximum is at 10 a.m., the other at 10 p.m.; the two minima are at 4 a.m. and 4 p.m. The heating effect of the sun can explain neither the time when the maxima appear nor the time of the minima of these semidiurnal variations. If the pressure becomes lower without the air becoming lighter through a lateral expansion due to heat, this must mean that the same mass of air gravitates with changing force at different hours.

Re: sandokahn's gravity-effect-on-air theory
« Reply #67 on: September 19, 2013, 07:38:26 AM »
Do you know how many times you repeated the same thing over and over here?

Clouds can have a height ranging from 50 meters to over 5 km, and a length ranging from 100 meters to 1000 km; a cumulus cloud, 1 kilometer in diameter, will weigh 5 MILLION TONS, or about the weight of 1 million cars. A cumulonimbus cloud, 5 kilometers in height, and having a diameter of 15 kilometers, will actually weigh 1 BILLION TONS.
The water in a cloud can have a mass of several million tons.
Official science: typical cumulus cloud has some 1/2 g per cubic meter of water density
Typical cumulus cloud = one cubic kilometer in size = one billion km in volume
total water content of the cloud = 500,000,000 grams of water, or 1.1 million pounds
Official science: typical cumulus cloud has some 1/2 g per cubic meter of water density
Typical cumulus cloud = one cubic kilometer in size = one billion m in volume
total water content of the cloud = 500,000,000 grams of water, or 1.1 million pounds
Water, though eight hundred times heavier than air, is held in droplets, by the millions of tons, miles above the ground.
Clouds can have a height ranging from 50 meters to over 5 km, and a length ranging from 100 meters to 1000 km; a cumulus cloud, 1 kilometer in diameter, will weigh 5 MILLION TONS, or about the weight of 1 million cars. A cumulonimbus cloud, 5 kilometers in height, and having a diameter of 15 kilometers, will actually weigh 1 BILLION TONS.


Did you at least read what I said?

And do you know that there is around 1300g of air per m3 so 0.5g/m3 is very small compared to that?

Or even what yourself has said?

NB: The atmosphere weighs more than 4 million billion tons.

If there is an updraft, it doesn't only lift the cloud above it but also the whole air that contains that cloud. And that air, sandokhan, is much heavier than your cloud!
To be honest I am fed up talking to someone that sounds like a broken record.

EDIT: Oh, one small question before I go, do you know why the rain falls to the ground? There is a force which attracts those drops of water to the ground and it's called ..... GRAVITY
« Last Edit: September 19, 2013, 07:49:09 AM by Cartesian »
I think, therefore I am

?

rottingroom

  • 4785
  • Around the world.
Re: sandokahn's gravity-effect-on-air theory
« Reply #68 on: September 19, 2013, 09:16:37 AM »
So far the basis of your argument has all stemmed from this quote by Rayleigh which you have posted over and over:

In speaking of the diurnal and semidiurnal variations of the barometer, Lord Rayleigh says: "The relative magnitude of the latter [semidiurnal variations], as observed at most parts of the earth’s surface, is still a mystery, all the attempted explanations being illusory."

Notice the parts that I have bolded.

Your argument relies on this punchline:

"THIS HAPPENS EACH AND EVERY DAY, EVERYWHERE."

Do you see the contradiction here?

All that I have to do to win this debate is simply show you that it does not happen everywhere. Your very own copypasta which you have repasted OVER AND OVER implies that it DOES NOT HAPPEN EVERYWHERE.

So then I show you observations of pressure and you spout an accusation of error in my arguments.

This is from the link which you provided: http://oceanservice.noaa.gov/education/yos/resource/JetStream/atmos/pressure.htm

"Because of this decrease in pressure with height, it makes it very hard to compare the air pressure at one location to another, especially when the elevations of each site differ. Therefore, to give meaning to the pressure values observed at each station, we need to convert the station air pressures reading to a value with a common dominator.

The common dominator we use is the sea-level. At observation stations around the world, through a series of calculations, the air pressure reading, regardless of the station elevation, is converted a value that would be observed if that instrument were located at sea level."

The station pressure is the true pressure at that station and mslp (for meteorolgy) and altimeter (for aircraft) are both calculated numbers using lapse rates.

The links I provided, at least some of them, provide all three numbers. I have told you this over and over again but really, it does not matter anyway. The thing to take away from these numbers is whether or not we get a change in pressure going the opposite direction of where it was going. In that case it doesn't matter what type of number is used.

Since I have shown you a place where that semidiurnal variation does not occur (something that even according to Lord Rayleigh is possible and happens at some places) then all that needs to be done is to determine what makes those places different than the places that do have a semidiurnal change.

I have already gone through what geography constitutes these differences. It is attributed to local weather, cloud cover and microscale events. When those are not happening we get a diurnal effect.

There is nothing more to say on this.

Your claim that this "paradox" happens everywhere all the time is shown to be incorrect and was incorrect all along as mentioned by Rayleigh himself.

« Last Edit: September 19, 2013, 03:32:25 PM by rottingroom »

Re: sandokahn's gravity-effect-on-air theory
« Reply #69 on: September 19, 2013, 11:34:48 AM »
Quote
(antonio, the reference for the pockets of noxious gas is this: W.J. Humphreys, Physics of the Air, 1940, p.227 - Atmospheric Circulation, Winds Adverse to Aviation chapter)

As I said, those values cannot help your case at all: updrafts can be debunked immediately. Your requests are way beyond the scope of our discussion, an unnecessary diversion on your part which does not work with me. If you are really interested in this subject, please do the research yourself: remember, you have to prove that the updraft (upward moving air) LASTS FOR THE ENTIRE RECORDED TRAJECTORY OF THE CUMULONIMBUS CLOUD, 5 kilometers in height, and having a diameter of 15 kilometers, WEIGHING 1 BILLION TONS.

Reread the Cloud Trajectories Paradox: there is no way you can explain the restoring forces paradox.

As for your video (a very interesting cloud formation pattern), you must understand the cyclone/anticyclone paradox, which no heliocentrist (like yourself) can explain:

There is no diversion, as before considering some extraordinary explanations, you should perhaps start with the basics You skipped this first step, and you are still avoiding my simple request.

We may go step by step, so before talking about cumulonimbus ( we'll come back on them) , I suggest to start with the cloud depicted in the video.
You are invoking cyclones and anticyclones, but they are involved in a much bigger scale. We are here at a kilometric scale, not thousands.
Please, can you explain with less than 200 characters  ;)  how this massive and heavy cloud can float and be absolutely still, obviously facing a strong wind? . What is your theory ?


?

11cookeaw1

Re: sandokahn's gravity-effect-on-air theory
« Reply #70 on: September 19, 2013, 12:47:23 PM »
Have you ever seen steam rise? That's water, the water you say shouldn't be able to form clouds. It's because the water while in a cloud is initially made up of individual molecules not connected together. These molecules are no denser then molecules in the air. Also, for tiny drops the surface area to mass ratio is very high, allowing wind to keep them up before the form drops to large.

*

sokarul

  • 19303
  • Extra Racist
Re: sandokahn's gravity-effect-on-air theory
« Reply #71 on: September 19, 2013, 03:20:58 PM »
I'm going to simplify one of sandokhan, stop me if I'm wrong. Liquids separate by density because of gravity. Air doesn't separate by density. Therefore gravity doesn't exist.

No flaws at all.
ANNIHILATOR OF  SHIFTER

It's no slur if it's fact.

*

sandokhan

  • Flat Earth Sultan
  • Flat Earth Scientist
  • 7138
Re: sandokahn's gravity-effect-on-air theory
« Reply #72 on: September 20, 2013, 01:16:47 AM »
cartesian...you have a crude and brutish approach to science.

There is no updraft that could explain how a cumulonimbus cloud, weighing at some 1 BILLION TONS, floats effortlessly in front of our eyes.

To claim that an updraft appears suddenly and carries each cloud along on its trajectory, no matter what weight, its direction, is ludicrous, to say the least.

You wrote, confirming your brutish approach to scientific thought:

EDIT: Oh, one small question before I go, do you know why the rain falls to the ground? There is a force which attracts those drops of water to the ground and it's called ..... GRAVITY

There is no such thing as attractive gravity: see the Bruce DePalma spinning ball experiment, the Barometer Pressure Paradox, and much more.

Drops of water (rain) fall to the ground because of the influence of PRESSURE GRAVITY (dextrorotatory telluric waves, proven to exist by the experiments carried out by Dr. Dayton Miller) on those very drops.

This could only happen on a flat surface of the Earth.

The Tunguska event proves clearly that the surface of the Earth is flat.


Let go back to the points I made, which you ignore completely each and every time.

Clouds ARE NOT water vapour: they are either water droplets or ice crystals.

Official science explanation: Clouds stay aloft for the same reason that dust motes floating around, also heavier than air: air drafts push them around.

But, just like the pseudo-explanation you came up with, this cannot be true.

But that doesn't explain why water molecules condensed into liquid form 1000 times denser than the air directly below them, manage to suspend themselves against gravity.

Please read carefully.

The cloud argument based on wind holding them up does not work in this case. And neither does the moist air less dense than dry air argument (although that doesn't work for clouds either because we are talking about condensed water in liquid form not the gaseous vapour form).

Fog can appear on frozen lakes so I doubt covection is operating in that case. We are talking about droplets that are 1000 times the density and weight of the very slow moving warm air below moving upward. There shouldn't be any physical process to overide the gravity pulling on those droplets.

I think it's obvious there is another unexplained process of an electrical nature suspending the water against the pull of gravity.


More details.

I find it hard to accept that 1000 times denser and heavier water droplets are able to be suspended by air molecules. They may counteract the pull of gravity for a short while for but the weight should overwhelm this buffeting pretty quick. For it to last even a short while the air molecules would need to be flowing mainly upwards but this certainly isn't true within a milimeter of the surface of the earth. There is a reason the gravity is counteracted and its not convection or updraft. I only state that I believe the reason to have an electrical nature.

I am certain that electricity plays a far larger role generally in the atmosphere than the mainstream is aware of or is willing to admit.

Floating clouds that defy gravity are a direct observational contradiction to the pseudoscientific cult of gravitation.


antonio, you tried this kind of approach before...at the Moon Radio thread...it did not work then, it won't work now.

There is always a very good reason I mention something in my messages: the cyclones/anticyclones information is meant to increase your knowledge about atmospheric physics.

In the context of the round earth theory, YOUR VIDEO IS COMPLETELY UNEXPLAINABLE.

A lenticular cloud is formed by the action of the telluric currents (the vortices created by them).

Let me show just how little you know about this subject.

http://www.thunderbolts.info/tpod/2007/arch07/071217electricclouds.htm

Cloud formations often exhibit structure that could be the result of something other than blowing winds. Does ionized plasma actually shape the clouds?

In a recent press release, scientists from the Weizmann Institute and the Goddard Space Flight Center announced that a mysterious zone of previously undiscovered particles fills the airspace around clouds.

The very formation of a cloud, its effortless floating although its weight runs in the millions of tons, is explained by the fact that terrestrial gravity = electricity = magnetism, just as proved by the Biefeld-Brown effect.


Anvil clouds are even more mysterious.


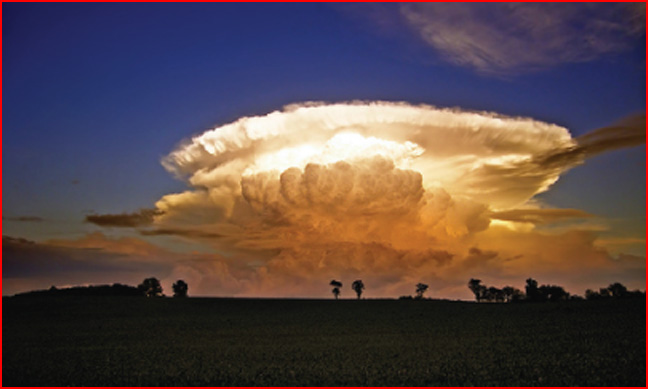
Official science: Anvil clouds form in the tops of thunderstorms 5 to 10 miles high and consist mainly of ice.

Therefore, your own very video proves that cloud formation/trajectories are explainable only by taking into account the vortex theory of terrestrial gravity.


There is no diversion, as before considering some extraordinary explanations, you should perhaps start with the basics You skipped this first step, and you are still avoiding my simple request.

How many times do we really have to go through this? I have studied very carefully cloud droplet microphysics. There is nothing there that explains how a cumulonimbus cloud weighing some 1 billion tons can float IN SPITE of attractive gravity.


rottingroundearththeory, you are the same person who wrote this:

At night time the air is going to cool which will increase your barometric pressure. As heating occurs, pressure will lower to give you this "10am" maximum and then your minimum at "4pm".  At this time the offset occurs in which pressure starts to increase again giving you that minimum. It is merely heat transfer affecting the gas particles as each transition occurs and it is that transition that gives you the semidiurnal max and min.

YOU HAVE NO KNOWLEDGE OF THE VERY BASIC FACTS OF PHYSICS.

In the world in which you live, A MAXIMUM AMOUNT OF BAROMETRIC PRESSURE IS ACHIEVED BY A LOWERING THE SAME PRESSURE.

Brilliant.


You wrote further:

Clouds and mist are aerosols.

Again, no knowledge of atmospheric physics.

Aerosols INTERACT WITH CLOUDS, they are not clouds.


I ask you again, DO YOU UNDERSTAND ENGLISH?

From the National Weather Service website:

The most basic change in pressure is the twice daily rise and fall in due to the heating from the sun. Each day, around 4 a.m./p.m. the pressure is at its lowest and near its peak around 10 a.m./p.m. The magnitude of the daily cycle is greatest near the equator decreasing toward the poles.

http://oceanservice.noaa.gov/education/yos/resource/JetStream/atmos/pressure.htm

YOU STILL DO NOT UNDERSTAND THE DIFFERENCE BETWEEN SEA LEVEL PRESSURE MEASUREMENTS AND TRUE BAROMETER/ABSOLUTE MEASUREMENTS, DO YOU?

At observation stations around the world, through a series of calculations, the air pressure reading, regardless of the station elevation, is converted a value that would be observed if that instrument were located at sea level.

Can't you even understand something as basic as this?

The sea level pressure measurements cannot be used to study the semidiurnal patterns of the pressure of the barometer, as they are used for a very quick estimation of the pressure.

To scientifically study true/absolute barometer pressure, you calculations must be much more involved.


Have you really lost your mind?

You NEVER showed anything other than sea level pressure measurements, nothing else: you have never shown that the semidiurnal barometer changes do not actuall occur somewhere.


Let us go through the same routine again, this time maybe you will understand.


http://books.google.ro/books?id=vNkZAQAAIAAJ&pg=RA1-PA217&lpg=RA1-PA217&dq=barometer+pressure+semidiurnal+change+10+am+4+pm&source=bl&ots=zgQHfJMC_w&sig=NMbmgLuqwPVwEfGVp3WuSu8Mdgg&hl=ro&sa=X&ei=-As4UqWRL4qp4ATI2ICIBA&ved=0CEAQ6AEwAQ#v=onepage&q=barometer%20pressure%20semidiurnal%20change%2010%20am%204%20pm&f=false

THIS IS REAL SCIENCE: DAILY SEMIDIURNAL CHANGES IN THE BAROMETER PRESSURE READING.

Maximums at 10:00 am and 10:00 pm, and minimums at 4:00 am and 4:00 pm.

HERE IS THE REAL DATA ON TAIWAN:

http://www-das.uwyo.edu/~geerts/cwx/notes/chap01/diurnal.html

Surface pressure measurements in Taiwan (at 25 deg. N) are least around 4am and (especially) 4 pm Local Standard Time, and most around (especially) 10am, and 10pm LST; the amplitude of the semidiurnal cycle is about 1.4 hPa.

My links provide the correct information about the maximums and minimums of the barometric pressure readings, as always.

Lord Rayleigh says: ‘The relative magnitude of the latter [semidiurnal variations], as observed at most parts of the earth’s surface, is still a mystery, all the attempted explanations being illusory.’

Most parts, that is, WHERE THE PHENOMENON WAS ACTUALLY STUDIED. In other parts, the measurements were simply not performed, that is what Lord Rayleigh meant.

You can find more of what actually Lord Rayleigh meant in his paper:

1890, On the vibrations of an atmosphere, Phil. Mag. (5), 29, pg. 173-180.


Now, the precise demonstration that the barometer pressure paradox DEFIES ATTRACTIVE GRAVITY.

One maximum is at 10 a.m., the other at 10 p.m.; the two minima are at 4 a.m. and 4 p.m. The heating effect of the sun can explain neither the time when the maxima appear nor the time of the minima of these semidiurnal variations. If the pressure becomes lower without the air becoming lighter through a lateral expansion due to heat, this must mean that the same mass of air gravitates with changing force at different hours.

THIS HAPPENS EVERYWHERE, EACH AND EVERY DAY, as documented in the links I provided here so clearly.

NATIONAL WEATHER SERVICE official information

The most basic change in pressure is the twice daily rise and fall in due to the heating from the sun. Each day, around 4 a.m./p.m. the pressure is at its lowest and near its peak around 10 a.m./p.m. The magnitude of the daily cycle is greatest near the equator decreasing toward the poles.

http://oceanservice.noaa.gov/education/yos/resource/JetStream/atmos/pressure.htm

For example, here is the data in Taiwan:


http://www-das.uwyo.edu/~geerts/cwx/notes/chap01/diurnal.html

Surface pressure measurements in Taiwan (at 25 deg. N) are least around 4am and (especially) 4 pm Local Standard Time, and most around (especially) 10am, and 10pm LST; the amplitude of the semidiurnal cycle is about 1.4 hPa.

It has been known now for two and a half centuries, that there are more or less daily variations in the height of the barometer, culminating in two maxima and two minima during the course of 24 hours. The same observation has been made and puzzled over at every station at which pressure records were kept and studied, but without success in finding for it the complete physical explanation.


AGAIN, PLEASE UNDERSTAND.

One maximum is at 10 a.m., the other at 10 p.m.; the two minima are at 4 a.m. and 4 p.m. The heating effect of the sun can explain neither the time when the maxima appear nor the time of the minima of these semidiurnal variations. If the pressure becomes lower without the air becoming lighter through a lateral expansion due to heat, this must mean that the same mass of air gravitates with changing force at different hours.

Re: sandokahn's gravity-effect-on-air theory
« Reply #73 on: September 20, 2013, 02:21:06 AM »
Here goes the copy pasta again. And don't bring your Tunguska stuff here. I already showed that you were intentionally misleading poor readers in another thread.
I think, therefore I am

*

sokarul

  • 19303
  • Extra Racist
Re: sandokahn's gravity-effect-on-air theory
« Reply #74 on: September 20, 2013, 05:37:58 AM »
I am certain that electricity plays a far larger role generally in the atmosphere than the mainstream is aware of or is willing to admit.
Explain it to show you understand.
ANNIHILATOR OF  SHIFTER

It's no slur if it's fact.

?

rottingroom

  • 4785
  • Around the world.
Re: sandokahn's gravity-effect-on-air theory
« Reply #75 on: September 20, 2013, 06:25:44 AM »
He is misleading readers again. I'm done with his ignorance.

*

sandokhan

  • Flat Earth Sultan
  • Flat Earth Scientist
  • 7138
Re: sandokahn's gravity-effect-on-air theory
« Reply #76 on: September 20, 2013, 06:41:48 AM »
Let me demonstrate first that electricity = magnetism.

A brief description: the magnetic field consists of strings of subquarks (magnetic monopoles) which circulate between the two poles of the magnet (BOTH N-S and S-N, as we shall see). Through the subquarks we have a flow of bosons/antibosons.

In a conductor, which consists of the same subquark strings, these subquarks align themselves to allow the boson flow (what we actually call electricity).

The same phenomenon: one is a flow of bosons through subquarks outside a conductor, the other a flow of bosons inside a conductor.

The subquark strings are made up of two helices: a laevorotatory spin, and a dextrorotatory spin.

Terrestrial gravity is the DEXTROROTATORY SPIN SUBQUARK STRING; the laevorotatory offers the opposing force, the antigravitational energy needed to explain the DePalma, Kozyrev, and Brown experiments.


It is now time to see what an actual unit of electromagnetic radiation looks like.


http://freeenergycommunity.files.wordpress.com/2011/08/the-secret-world-of-magnets-spintronics-2006-howard-johnson.pdf (mapping of magnetic fields)


Magnetic Monopoles Detected In A Real Magnet For The First Time:

http://www.sciencedaily.com/releases/2009/09/090903163725.htm


Therefore, the magnetic field of a permanent magnet has four vortices (actually two, but each one is composed of a receptive and an emissive part), and a center, out of which these vortices emerge. This magnetic field consists of magnetic monopoles which travel in both senses (north-south AND south-north), in contradiction to what we have been taught so far (only north-south direction).

NOW, WE PROVE THAT THE MAGNETIC MONOPOLES ARE ACTUALLY SUBQUARKS.


The correct atomic weights predicted for each element decades ahead of the discovery some of them, and the start of the modern quantum physics.

For many decades, scientists have been trying to devise a single unified theory to explain all known physical phenomena, but a model that appears to unite the seemingly incompatible String Theory and Standard Model has existed for 100 years. It described baryons, mesons, quarks and preons over 50 years before conventional science. It stated that matter is composed of strings 80 years before string theory. It described the existence of anti-matter 30 years before conventional science. It described the Higgs field over 50 years before Peter Higgs. It described the existence of isotopes 5 years before conventional science.


Now we will see that the magnetic monopoles discovered recently, and which do form a magnetic field, are actually subquarks.

HYDROGEN ATOM: 18 SUBQUARKS - 9 LAEVOROTATORY AND 9 DEXTROROTATORY subquarks

A proton is made up of NINE laevorotatory subquarks - an electron is actually comprised of NINE dextrorotatory subquarks (called now preons).

However, modern science has mistakenly named a SINGLE dextrorotatory subquark as an electron and has ascribed THE TOTAL charge of the NINE corresponding subquarks as the total negative charge of a single electron, thus confusing the whole matter.

http://www.subtleenergies.com/ormus/oc/fig001.gi

Seven possible shapes for the atoms:

http://www.subtleenergies.com/ormus/oc/fig010.gif

A baryon, or the fourth state of ether (groups of nine subquarks):

http://www.subtleenergies.com/ormus/oc/fig009.gif

Mesons, third state of ether, groups of six subquarks:

http://www.subtleenergies.com/ormus/oc/fig008.gif

Quarks, second state of ether, groups of three subquarks:

http://www.subtleenergies.com/ormus/oc/fig007.gif


MAGNETIC MONOPOLES, SUBQUARKS, TACHYONS, PREONS, OMEGANS:


First state of ether

A magnetic monopole or subquark consists of strings of bosons and antibosons (boson = photon = neutrino).

The neutrino was first postulated in 1930 when it was found that, from the standpoint of relativity theory, beta decay (the decay of a neutron into a proton and an electron) seemed to violate the conservation of energy. Wolfgang Pauli saved the day by inventing the neutrino, a particle that would be emitted along with every electron and carry away energy and momentum (the emitted particle is nowadays said to be an antineutrino).

W.A. Scott Murray described this as ‘an implausible ad hoc suggestion designed to make the experimental facts agree with the theory and not far removed from a confidence trick’.

Aspden calls the neutrino ‘a figment of the imagination invented in order to make the books balance’ and says that it simply denotes ‘the capacity of the aether to absorb energy and momentum’.

Let us remember that in one extension to the Standard Model, left- and right-handed neutrinos exist. These Dirac neutrinos acquire mass via the Higgs mechanism but right-handed neutrinos interact much more weakly than any other particles.


To achieve a faster than light speed means to somehow increase the vibration of an ordinary atom (groups of 18 subquarks) to a higher level which approaches that of the fourth state of ether made up of 9 groups of subquarks.


BASIC LAW OF ETHER WAVES (which consist, as we have seen, of two strings which travel in double torsion, one laevorotatory, one dextrorotatory) specified by Nikola Tesla:

ETHER IS MADE RIGID BY APPLYING HIGH VOLTAGE, HIGH FREQUENCY ELECTRICITY

This rigidness can become, eventually, ball lightning: ether waves which no longer travel through aether, but which are "trapped" in a torsion torus.


The original set of Maxwell's equations prove the very same thing.

http://www.theflatearthsociety.org/forum/index.php/topic,58190.msg1489693.html#msg1489693

http://www.theflatearthsociety.org/forum/index.php/topic,58190.msg1489785.html#msg1489785


The ground and the ionosphere induce secondary charge-layers in the atmosphere. In such a secondary layer cloud-building takes place. Generation of electricity in clouds is due not to the friction of neutral clouds on mountain ridges, or to the friction of neutral clouds among themselves, or to the friction of droplets by the gravitational pull on them, but to the fact that droplets rise already charged toward the charged layer of the atmosphere, and clouds are further subjected to induction by the ground and the ionosphere. This explains also the segregation of the charges in the upper and lower levels of the clouds.

Referees who believe atmospheric electricity is an effect, rather than a cause of weather, would almost certainly find grounds for rejecting funding for, or publication of, such an experiment. The same applies to the publication of reports from credible eyewitnesses. For decades airline pilots witnessed strange lightning above storms but were discouraged from reporting it. The objection is unfair and unscientific. Advances come from challenging established beliefs.

It is proposed that water droplets in clouds experience an antigravity effect. It appears to be related to the Biefield-Brown Effect, where a charged high-voltage planar capacitor tends to move in the direction of the positive electrode. That effect may explain how millions of tons of water can be suspended kilometers above the ground, when cloud droplets are about 1,000 times denser than the surrounding air.


The only possible explanation for the flow of clouds which weigh in excess of 1 BILLION TONS, is the Biefeld-Brown effect.

Just like in the DePalma experiment, the laevorotatory subquarks in the cloud/spinning ball receive energy from the laevorotatory subquarks in the telluric currents (by left-spin rotation, by applying electricity, or even by sound): thus the antigravitational effect.

http://www.theflatearthsociety.org/forum/index.php/topic,59837.msg1540153.html#msg1540153

http://www.theflatearthsociety.org/forum/index.php/topic,59837.msg1540161.html#msg1540161


*

sandokhan

  • Flat Earth Sultan
  • Flat Earth Scientist
  • 7138
Re: sandokahn's gravity-effect-on-air theory
« Reply #77 on: September 20, 2013, 06:47:25 AM »
You, rottingroom, have shown the UTMOST DISRESPECT FOR YOUR READERS HERE.

You have tried diligently to mislead them all the time.

I have never mislead anybody here, on the contrary, the proof that the barometer pressure paradox DEFIES ATTRACTIVE GRAVITY is very simple.


Here is how you tried to mislead your readers.

At night time the air is going to cool which will increase your barometric pressure. As heating occurs, pressure will lower to give you this "10am" maximum and then your minimum at "4pm".  At this time the offset occurs in which pressure starts to increase again giving you that minimum. It is merely heat transfer affecting the gas particles as each transition occurs and it is that transition that gives you the semidiurnal max and min.

YOU HAVE NO KNOWLEDGE OF THE VERY BASIC FACTS OF PHYSICS.

In the world in which you live, A MAXIMUM AMOUNT OF BAROMETRIC PRESSURE IS ACHIEVED BY A LOWERING THE SAME PRESSURE.

You wrote further:

Clouds and mist are aerosols.

Again, no knowledge of atmospheric physics.

Aerosols INTERACT WITH CLOUDS, they are not clouds.


You tried to mislead your readers by presenting SEA LEVEL PRESSURE MEASUREMENTS AS ABSOLUTE BAROMETER PRESSURE DATA, a grievious mistake.


http://books.google.ro/books?id=vNkZAQAAIAAJ&pg=RA1-PA217&lpg=RA1-PA217&dq=barometer+pressure+semidiurnal+change+10+am+4+pm&source=bl&ots=zgQHfJMC_w&sig=NMbmgLuqwPVwEfGVp3WuSu8Mdgg&hl=ro&sa=X&ei=-As4UqWRL4qp4ATI2ICIBA&ved=0CEAQ6AEwAQ#v=onepage&q=barometer%20pressure%20semidiurnal%20change%2010%20am%204%20pm&f=false

THIS IS REAL SCIENCE: DAILY SEMIDIURNAL CHANGES IN THE BAROMETER PRESSURE READING.

Maximums at 10:00 am and 10:00 pm, and minimums at 4:00 am and 4:00 pm.

HERE IS THE REAL DATA ON TAIWAN:

http://www-das.uwyo.edu/~geerts/cwx/notes/chap01/diurnal.html

Surface pressure measurements in Taiwan (at 25 deg. N) are least around 4am and (especially) 4 pm Local Standard Time, and most around (especially) 10am, and 10pm LST; the amplitude of the semidiurnal cycle is about 1.4 hPa.

My links provide the correct information about the maximums and minimums of the barometric pressure readings, as always.

Now, the precise demonstration that the barometer pressure paradox DEFIES ATTRACTIVE GRAVITY.

One maximum is at 10 a.m., the other at 10 p.m.; the two minima are at 4 a.m. and 4 p.m. The heating effect of the sun can explain neither the time when the maxima appear nor the time of the minima of these semidiurnal variations. If the pressure becomes lower without the air becoming lighter through a lateral expansion due to heat, this must mean that the same mass of air gravitates with changing force at different hours.

THIS HAPPENS EVERYWHERE, EACH AND EVERY DAY, as documented in the links I provided here so clearly.

NATIONAL WEATHER SERVICE official information

The most basic change in pressure is the twice daily rise and fall in due to the heating from the sun. Each day, around 4 a.m./p.m. the pressure is at its lowest and near its peak around 10 a.m./p.m. The magnitude of the daily cycle is greatest near the equator decreasing toward the poles.

http://oceanservice.noaa.gov/education/yos/resource/JetStream/atmos/pressure.htm


AGAIN, PLEASE UNDERSTAND.

One maximum is at 10 a.m., the other at 10 p.m.; the two minima are at 4 a.m. and 4 p.m. The heating effect of the sun can explain neither the time when the maxima appear nor the time of the minima of these semidiurnal variations. If the pressure becomes lower without the air becoming lighter through a lateral expansion due to heat, this must mean that the same mass of air gravitates with changing force at different hours.

?

rottingroom

  • 4785
  • Around the world.
Re: sandokahn's gravity-effect-on-air theory
« Reply #78 on: September 20, 2013, 06:52:06 AM »
I did not mislead readers. I made my own mistakes and admitted to them. You have mislead readers and have denied the explanations I've given by simply repasting the same thing over and over. I don't have time for you. Its too tedious and evidently pointless.

*

sandokhan

  • Flat Earth Sultan
  • Flat Earth Scientist
  • 7138
Re: sandokahn's gravity-effect-on-air theory
« Reply #79 on: September 20, 2013, 07:00:26 AM »
You have problems which cannot be cured/dealt with here.

No misleading on my part, ever.

You tried to mislead your readers by presenting SEA LEVEL PRESSURE MEASUREMENTS AS ABSOLUTE BAROMETER PRESSURE DATA, a grievious mistake.


http://books.google.ro/books?id=vNkZAQAAIAAJ&pg=RA1-PA217&lpg=RA1-PA217&dq=barometer+pressure+semidiurnal+change+10+am+4+pm&source=bl&ots=zgQHfJMC_w&sig=NMbmgLuqwPVwEfGVp3WuSu8Mdgg&hl=ro&sa=X&ei=-As4UqWRL4qp4ATI2ICIBA&ved=0CEAQ6AEwAQ#v=onepage&q=barometer%20pressure%20semidiurnal%20change%2010%20am%204%20pm&f=false

THIS IS REAL SCIENCE: DAILY SEMIDIURNAL CHANGES IN THE BAROMETER PRESSURE READING.

Maximums at 10:00 am and 10:00 pm, and minimums at 4:00 am and 4:00 pm.

HERE IS THE REAL DATA ON TAIWAN:

http://www-das.uwyo.edu/~geerts/cwx/notes/chap01/diurnal.html

Surface pressure measurements in Taiwan (at 25 deg. N) are least around 4am and (especially) 4 pm Local Standard Time, and most around (especially) 10am, and 10pm LST; the amplitude of the semidiurnal cycle is about 1.4 hPa.

My links provide the correct information about the maximums and minimums of the barometric pressure readings, as always.

Now, the precise demonstration that the barometer pressure paradox DEFIES ATTRACTIVE GRAVITY.

One maximum is at 10 a.m., the other at 10 p.m.; the two minima are at 4 a.m. and 4 p.m. The heating effect of the sun can explain neither the time when the maxima appear nor the time of the minima of these semidiurnal variations. If the pressure becomes lower without the air becoming lighter through a lateral expansion due to heat, this must mean that the same mass of air gravitates with changing force at different hours.

THIS HAPPENS EVERYWHERE, EACH AND EVERY DAY, as documented in the links I provided here so clearly.

NATIONAL WEATHER SERVICE official information

The most basic change in pressure is the twice daily rise and fall in due to the heating from the sun. Each day, around 4 a.m./p.m. the pressure is at its lowest and near its peak around 10 a.m./p.m. The magnitude of the daily cycle is greatest near the equator decreasing toward the poles.

http://oceanservice.noaa.gov/education/yos/resource/JetStream/atmos/pressure.htm


AGAIN, PLEASE UNDERSTAND.

One maximum is at 10 a.m., the other at 10 p.m.; the two minima are at 4 a.m. and 4 p.m. The heating effect of the sun can explain neither the time when the maxima appear nor the time of the minima of these semidiurnal variations. If the pressure becomes lower without the air becoming lighter through a lateral expansion due to heat, this must mean that the same mass of air gravitates with changing force at different hours.


Lord Rayleigh, the National Weather Service, and all the foregoing references are not misleading anybody: THE EFFECT OF THE BAROMETER PRESSURE PARADOX HAPPENS EACH DAY AND IT CANNOT BE EXPLAINED, a clear defiance of the attractive gravity concept. End of story.


?

rottingroom

  • 4785
  • Around the world.
Re: sandokahn's gravity-effect-on-air theory
« Reply #80 on: September 20, 2013, 07:01:26 AM »
I'm responding from my phone so excuse the non-novel like responses.

You posting from Taiwan is only so relevant. To prove you wrong all I had to do is show any observation that contradicts that claim, and I did. I didn't just do that, I also explained what causes it to be semidiurnal vs what causes it to be diurnal.

Then, since you didn't like that you attacked mslp. Ignoring that my links provide station pressure which is the actual recorded pressure and while the mslp is a calculated number the only significant part of it is the change. That means that if station pressure goes up, then so does the mslp or altimeter and the same for if it goes down.

The mslp, if graphed will show the same changes as the station pressure. Thats all that matters, so you're argument about what pressure units are used is irrelevant.

So, I got nothing more to say. You clearly don't care about the information I've given you. If you did you would take a step back and consider that you are wrong.
« Last Edit: September 20, 2013, 07:04:31 AM by rottingroom »

*

sandokhan

  • Flat Earth Sultan
  • Flat Earth Scientist
  • 7138
Re: sandokahn's gravity-effect-on-air theory
« Reply #81 on: September 20, 2013, 07:07:16 AM »
You have lost any link to reality.

Remember, that your links provide information about the sea level and mean sea level pressure measurements.

This is much easier to perform than the actual absolute barometer pressure calculation.


That this is actually the case can be readily deduced from the very links you provided.

http://weather.noaa.gov/weather/current/RCSS.html

Take a look at the ARTIFICIAL NATURE OF THE DATA AT THE PRESSURE INCHES COLUMN.

MUCH OF THE SAME NUMBERS, REPEATED: 29.77 - 29.80 - 29.83 - 29.85

This means that we are dealing WITH SEA LEVEL PRESSURE CALCULATIONS, which, as I have said, are much easier to perform than actual absolute barometer measurements.

HERE IS THE REAL DATA ON TAIWAN:

http://www-das.uwyo.edu/~geerts/cwx/notes/chap01/diurnal.html

Surface pressure measurements in Taiwan (at 25 deg. N) are least around 4am and (especially) 4 pm Local Standard Time, and most around (especially) 10am, and 10pm LST; the amplitude of the semidiurnal cycle is about 1.4 hPa.

My links provide the correct information about the maximums and minimums of the barometric pressure readings, as always.


THE SAME ARTIFICIAL NUMBERS USED IN THE CORONADO LINK YOU PROVIDED.

http://www.wrh.noaa.gov/mesowest/getobext.php?wfo=sgx&sid=KNZY&num=72&raw=0

Station pressure: 29.764 - 29.774 - 29.754 - 29.744 ; also there is precise correlation between the SEA LEVEL PRESSURE data and the Station Pressure data: this only means that the sea level pressure and mean sea level pressure data was used AND NOT THE REAL ABSOLUTE BAROMETER MEASUREMENTS.


Your links/information AMOUNT TO NOTHING, you have no idea what you are writing, what you are posting.

OFFICIAL ATMOSPHERIC SCIENCE INFORMATION:

The mean sea level pressure (MSLP) is the atmospheric pressure at sea level or (when measured at a given elevation on land) the station pressure reduced to sea level assuming that the temperature falls at a lapse rate of 6.5 K per km in the fictive layer of air between the station and sea level.
This is the atmospheric pressure normally given in weather reports on radio, television, and newspapers or on the Internet. When barometers in the home are set to match the local weather reports, they measure pressure reduced to sea level, not the actual local atmospheric pressure. The reduction to sea level means that the normal range of fluctuations in atmospheric pressure is the same for everyone.

THIS IS THE INFORMATION CONTAINED IN YOUR LINKS, NOT THE ACTUAL BAROMETER PRESSURE MEASUREMENTS.

THIS IS THE REASON FOR THE ARTIFICIAL NATURE OF THE NUMBERS IN THE SEA LEVEL PRESSURE AND STATION PRESSURE DATA.


If the work is properly done, then this is what you will get:

http://books.google.ro/books?id=vNkZAQAAIAAJ&pg=RA1-PA217&lpg=RA1-PA217&dq=barometer+pressure+semidiurnal+change+10+am+4+pm&source=bl&ots=zgQHfJMC_w&sig=NMbmgLuqwPVwEfGVp3WuSu8Mdgg&hl=ro&sa=X&ei=-As4UqWRL4qp4ATI2ICIBA&ved=0CEAQ6AEwAQ#v=onepage&q=barometer%20pressure%20semidiurnal%20change%2010%20am%204%20pm&f=false

THIS IS REAL SCIENCE: DAILY SEMIDIURNAL CHANGES IN THE BAROMETER PRESSURE READING.

Maximums at 10:00 am and 10:00 pm, and minimums at 4:00 am and 4:00 pm.


STATION PRESSURE AS RECORDED IN THE LINKS YOU PROVIDED IS THE MEAN SEA LEVEL PRESSURE, not the real measurements. To calculate the absolute barometer is more complicated, that is why you brought here links with the wrong data/information.

You still FAIL to understand this crucial point, even though I carefully explained the situation to you.

This means you have lost any link with reality.


HERE IS THE REAL WORLD.

One maximum is at 10 a.m., the other at 10 p.m.; the two minima are at 4 a.m. and 4 p.m. The heating effect of the sun can explain neither the time when the maxima appear nor the time of the minima of these semidiurnal variations. If the pressure becomes lower without the air becoming lighter through a lateral expansion due to heat, this must mean that the same mass of air gravitates with changing force at different hours.


End of discussion. The daily semidiurnal changes in the barometric pressure readings, CANNOT BE EXPLAINED AT ALL:  If the pressure becomes lower without the air becoming lighter through a lateral expansion due to heat, this must mean that the same mass of air gravitates with changing force at different hours.

?

rottingroom

  • 4785
  • Around the world.
Re: sandokahn's gravity-effect-on-air theory
« Reply #82 on: September 20, 2013, 07:08:12 AM »
I do these measurements myself, everyday. We use a barometer to get station pressure then from that we calculate the altimeter and mslp. The station pressure is true pressure at that station.Which I provided. The graphs will look slightly different if we graphed each but the changes in direction of pressure would be the same.

So that is not misleading. It is relevant to your argument about pressure changes. Which you are false about.

Please just respond to the specific points I make and don't repaste the same things.

?

rottingroom

  • 4785
  • Around the world.
Re: sandokahn's gravity-effect-on-air theory
« Reply #83 on: September 20, 2013, 07:15:45 AM »
Are you saying that if we take the example I provided at twenty nine palms which I showed to be diurnal and if I took the "real" pressure at the station then we would get a semi diurnal curve?

Care to show me that. Do it for twenty nine palms with today's observations from NOAA.

I bet you that it will show the same changes and it will be diurnal. Stop relying on one observation. Use any observation in a place with "perfect air" and you'll see a diurnal curve. Its just a fact.

*

sandokhan

  • Flat Earth Sultan
  • Flat Earth Scientist
  • 7138
Re: sandokahn's gravity-effect-on-air theory
« Reply #84 on: September 20, 2013, 07:26:22 AM »
He confused aerosols with clouds, he said that the maximum pressure is achieved by the continuous lowering of the same pressure...and now he cannot understand the difference between the station pressure and absolute barometer pressure measurements.


http://www.wrh.noaa.gov/mesowest/getobext.php?wfo=sgx&sid=KNZY&num=72&raw=0

Station pressure: 29.764 - 29.774 - 29.754 - 29.744 ; also there is precise correlation between the SEA LEVEL PRESSURE data and the Station Pressure data: this only means that the sea level pressure and mean sea level pressure data was used AND NOT THE REAL ABSOLUTE BAROMETER MEASUREMENTS.


ARE YOU ALL THERE ROTTINGROOM?


At observation stations around the world, through a series of calculations, the air pressure reading, regardless of the station elevation, is converted a value that would be observed if that instrument were located at sea level.

Can't you even understand something as basic as this?

To scientifically study true/absolute barometer pressure, your calculations must be much more involved.


Again, take a look at the very data you provided as truth:


http://www.wrh.noaa.gov/mesowest/getobext.php?wfo=sgx&sid=KNZY&num=72&raw=0

Station pressure: 29.764 - 29.774 - 29.754 - 29.744 ; also there is precise correlation between the SEA LEVEL PRESSURE data and the Station Pressure data: this only means that the sea level pressure and mean sea level pressure data was used AND NOT THE REAL ABSOLUTE BAROMETER MEASUREMENTS.


The station pressure data is just as artificial as are the sea level pressure measurements: there is a direct correlation between the two.


Again, here is the real world of barometer pressure measurements.


http://books.google.ro/books?id=vNkZAQAAIAAJ&pg=RA1-PA217&lpg=RA1-PA217&dq=barometer+pressure+semidiurnal+change+10+am+4+pm&source=bl&ots=zgQHfJMC_w&sig=NMbmgLuqwPVwEfGVp3WuSu8Mdgg&hl=ro&sa=X&ei=-As4UqWRL4qp4ATI2ICIBA&ved=0CEAQ6AEwAQ#v=onepage&q=barometer%20pressure%20semidiurnal%20change%2010%20am%204%20pm&f=false

THIS IS REAL SCIENCE: DAILY SEMIDIURNAL CHANGES IN THE BAROMETER PRESSURE READING.

Maximums at 10:00 am and 10:00 pm, and minimums at 4:00 am and 4:00 pm.

HERE IS THE REAL DATA ON TAIWAN:

http://www-das.uwyo.edu/~geerts/cwx/notes/chap01/diurnal.html

Surface pressure measurements in Taiwan (at 25 deg. N) are least around 4am and (especially) 4 pm Local Standard Time, and most around (especially) 10am, and 10pm LST; the amplitude of the semidiurnal cycle is about 1.4 hPa.


Now, the precise demonstration that the barometer pressure paradox DEFIES ATTRACTIVE GRAVITY.

One maximum is at 10 a.m., the other at 10 p.m.; the two minima are at 4 a.m. and 4 p.m. The heating effect of the sun can explain neither the time when the maxima appear nor the time of the minima of these semidiurnal variations. If the pressure becomes lower without the air becoming lighter through a lateral expansion due to heat, this must mean that the same mass of air gravitates with changing force at different hours.


The same National Weather Service website says this:

The most basic change in pressure is the twice daily rise and fall in due to the heating from the sun. Each day, around 4 a.m./p.m. the pressure is at its lowest and near its peak around 10 a.m./p.m. The magnitude of the daily cycle is greatest near the equator decreasing toward the poles.

http://oceanservice.noaa.gov/education/yos/resource/JetStream/atmos/pressure.htm


A direct contradiction of the claims you have been making here: the Taiwan and Coronado data are sea level pressure and station pressure recordings which are correlated with each other.

Here is the real data on Taiwan:


http://www-das.uwyo.edu/~geerts/cwx/notes/chap01/diurnal.html

Surface pressure measurements in Taiwan (at 25 deg. N) are least around 4am and (especially) 4 pm Local Standard Time, and most around (especially) 10am, and 10pm LST; the amplitude of the semidiurnal cycle is about 1.4 hPa.

Can you understand English?


Are you saying that if we take the example I provided at twenty nine palms which I showed to be diurnal and if I took the "real" pressure at the station then we would get a semi diurnal curve?

Care to show me that. Do it for twenty nine palms with today's observations from NOAA.

I bet you that it will show the same changes and it will be diurnal. Stop relying on one observation. Use any observation in a place with "perfect air" and you'll see a diurnal curve. Its just a fact.


More nonsense from you.

You are completely divorced from reality.

You wrote:

Here is a link where you can confirm that my graph uses the correct numbers:

http://www.wrh.noaa.gov/mesowest/getobext.php?wfo=vef&sid=KNXP&num=72&raw=0

The same thing just as in Taiwan and Coronado:  the Taiwan and Coronado data are sea level pressure and station pressure recordings which are correlated with each other, here also.

If the measurements would be done correctly (calculated correctly) at Twenty Nine Palms, then you would record the proper data:


http://books.google.ro/books?id=vNkZAQAAIAAJ&pg=RA1-PA217&lpg=RA1-PA217&dq=barometer+pressure+semidiurnal+change+10+am+4+pm&source=bl&ots=zgQHfJMC_w&sig=NMbmgLuqwPVwEfGVp3WuSu8Mdgg&hl=ro&sa=X&ei=-As4UqWRL4qp4ATI2ICIBA&ved=0CEAQ6AEwAQ#v=onepage&q=barometer%20pressure%20semidiurnal%20change%2010%20am%204%20pm&f=false

THIS IS REAL SCIENCE: DAILY SEMIDIURNAL CHANGES IN THE BAROMETER PRESSURE READING.

Maximums at 10:00 am and 10:00 pm, and minimums at 4:00 am and 4:00 pm.


Are you able to understand this?

How long do we have to go through this?


NATIONAL WEATHER SERVICE official information

The most basic change in pressure is the twice daily rise and fall in due to the heating from the sun. Each day, around 4 a.m./p.m. the pressure is at its lowest and near its peak around 10 a.m./p.m. The magnitude of the daily cycle is greatest near the equator decreasing toward the poles.

http://oceanservice.noaa.gov/education/yos/resource/JetStream/atmos/pressure.htm


AGAIN, PLEASE UNDERSTAND.

One maximum is at 10 a.m., the other at 10 p.m.; the two minima are at 4 a.m. and 4 p.m. The heating effect of the sun can explain neither the time when the maxima appear nor the time of the minima of these semidiurnal variations. If the pressure becomes lower without the air becoming lighter through a lateral expansion due to heat, this must mean that the same mass of air gravitates with changing force at different hours.


« Last Edit: September 20, 2013, 07:29:40 AM by sandokhan »

?

rottingroom

  • 4785
  • Around the world.
Re: sandokahn's gravity-effect-on-air theory
« Reply #85 on: September 20, 2013, 07:31:33 AM »
You just repasted the same thing. Ignoring my points. This is crazy.

"STATION PRESSURE AS RECORDED IN THE LINKS YOU PROVIDED IS THE MEAN SEA LEVEL PRESSURE, not the real measurements. To calculate the absolute barometer is more complicated, that is why you brought here links with the wrong data/information."

Obviously incorrect. You think the mslp is obtained to calculate the station pressure? It works the other way around sandokhan. There is no sea level at a location above sea level! Station pressure is recorded and then mslp is derived from that. Obviously the only actual recordable pressure is that at the station.

Keep going with those ad hominem attacks though. Keep ignoring the relevant points that I make. Keep pasting.

Ignore. Paste. Ignore. Paste.

I ask again. Go to NOAA, search for twenty-nine palms and look at station pressure. Those are the numbers that come directly from the barometer. Station pressure.

Station Pressure.

Station Pressure.

Your point about mslp is irrelevant!

?

rottingroom

  • 4785
  • Around the world.
Re: sandokahn's gravity-effect-on-air theory
« Reply #86 on: September 20, 2013, 07:36:41 AM »
You can keep posting the same stuff. The statement that "the most basic change in pressure is yada yada" is not an observation. It's a statement about what usually occurs.

The keyword being usually.

Your claim is that it always happens. Not usually.

Actual observations indicate otherwise.

I am the only person that has shown actual observations. You have just shown statements that I don't even disagree with. We just interpret it differently. I say that semidiurnal variations are typical while you say they always happen. That is the disagreement.

So, my task is to show you ANY observation where it isn't semidiurnal.

I did that, so then you attack mslp.

Again, I showed links that show mslp AND station pressure.

Station pressure is the original recorded number direct from the barometer.

I didn't even mention MSLP in the first place!

*

sandokhan

  • Flat Earth Sultan
  • Flat Earth Scientist
  • 7138
Re: sandokahn's gravity-effect-on-air theory
« Reply #87 on: September 20, 2013, 07:48:23 AM »
I repeated the same data so you could see where you went wrong.

You still do not understand.

STATION PRESSURE = BAROMETER READING +- CALIBRATION CORRECTION


http://www.novalynx.com/manuals/bp-elevation-correction-tables.pdf


Weather stations located at elevations above sea level often need adjustment to the barometer so
that sea level pressure is the indicated value. Sometimes the information necessary making for the
adjustment is unavailable or is difficult to obtain.


Barometer corrections to sea level pressure are most often associated with airports, television
reports, or National Weather Service offices. These organizations give sea level reduced pressure
readings. Some large organizations may have networks of weather stations spread over a large
region to measure lateral variations in pressure such as those produced by weather fronts.


Barometric pressure corrections can be obtained by contacting a local airport or National Weather
Service weather station operator and requesting the current local reading. The barometer in
question is then adjusted so that its reading matches that obtained from the airport or NWS. Some
error will be introduced using this method of adjustment, increasing with distance since lateral
pressure variations may increase with the horizontal distance from the reporting weather station.
The tables provided with this document are based upon the United States Standard Atmosphere
and can be used in situations where no reporting stations exist within the immediate area. The
tables give the correction factor that is added to the barometric pressure reading for a given station
elevation. The correction is given both in inches of mercury (inHg) and in millibars (mb). Values are
indicated for elevations expressed in feet above sea level.

For any station elevation, add the “deviation from zero” figure to the barometer’s current
barometric pressure reading.


As an example, consider a barometer located at an elevation of 4550 feet with a current reading
of 25.07 inHg. Using the tables, a value of 4.60 inHg should be added to the reading. The
barometer should be adjusted until it produces a reading of 29.67 inHg to report the equivalent sea
level pressure.


THIS IS EXACTLY THE ARTIFICIAL NATURE OF THE DATA IN YOUR LINKS (WHICH COULD NOT POSSIBLY CONTRADICT THE VERY STATEMENT MADE BY THE NATIONAL WEATHER SERVICE WHICH SAYS CLEARLY: The most basic change in pressure is the twice daily rise and fall in due to the heating from the sun. Each day, around 4 a.m./p.m. the pressure is at its lowest and near its peak around 10 a.m./p.m. The magnitude of the daily cycle is greatest near the equator decreasing toward the poles.).


Again, take a look at the very data you provided as truth:


http://www.wrh.noaa.gov/mesowest/getobext.php?wfo=sgx&sid=KNZY&num=72&raw=0

Station pressure: 29.764 - 29.774 - 29.754 - 29.744 ; also there is precise correlation between the SEA LEVEL PRESSURE data and the Station Pressure data: this only means that the sea level pressure and mean sea level pressure data was used AND NOT THE REAL ABSOLUTE BAROMETER MEASUREMENTS.


The station pressure data is just as artificial as are the sea level pressure measurements: there is a direct correlation between the two.


Obviously, YOU HAD NO IDEA OF THESE FACTS, NO REAL BAROMETER PRESSURER MEASUREMENTS WERE EVER PERFORMED BY YOU.


The most basic change in pressure is the twice daily rise and fall in due to the heating from the sun. Each day, around 4 a.m./p.m. the pressure is at its lowest and near its peak around 10 a.m./p.m. The magnitude of the daily cycle is greatest near the equator decreasing toward the poles.

http://oceanservice.noaa.gov/education/yos/resource/JetStream/atmos/pressure.htm


A direct contradiction of the claims you have been making here: the Taiwan and Coronado data are sea level pressure and station pressure recordings which are correlated with each other.

Here is the real data on Taiwan:


http://www-das.uwyo.edu/~geerts/cwx/notes/chap01/diurnal.html

Surface pressure measurements in Taiwan (at 25 deg. N) are least around 4am and (especially) 4 pm Local Standard Time, and most around (especially) 10am, and 10pm LST; the amplitude of the semidiurnal cycle is about 1.4 hPa.


http://www.starpath.com/downloads/calibration_procedure.pd

I quote:

Thus there are always two steps to reading and reporting a proper sea level pressure. Step one is to read the instrument and then refer to the Barometer Calibration Table to make any necessary corrections. The calibration table (or graph) provides a unique correction for each barometer reading - in that sense, it is similar to a Deviation Table for a magnetic compass.

This correction can be plus or minus. ONCE THE CORRECTION HAS BEEN APPLIED, THE RESULT IS CALLED THE STATION PRESSURE FOR THAT INSTRUMENT LOCATION.


STATION PRESSURE = BAROMETER READING +- CALIBRATION CORRECTION

This the reason for the ARTIFICIAL DATA YOU PROVIDED.

Please study meteorology and leave real science to others.
« Last Edit: September 20, 2013, 07:50:57 AM by sandokhan »

?

rottingroom

  • 4785
  • Around the world.
Re: sandokahn's gravity-effect-on-air theory
« Reply #88 on: September 20, 2013, 07:54:31 AM »
It does not matter. You could use a completely uncalibrated barometer and it would still record the correct CHANGES. It would show the wrong numbers but it would still correctly show WHEN the pressure changed direction.

This is the part you don't understand.

I could use a thermometer that is off by 30 degrees but if my only objective was to determine when the temperature started to get colder, then it wouldn't matter.

Do you understand this point?

*

sandokhan

  • Flat Earth Sultan
  • Flat Earth Scientist
  • 7138
Re: sandokahn's gravity-effect-on-air theory
« Reply #89 on: September 20, 2013, 07:59:02 AM »
The data you provided as truth (Taiwan, Coronado, Twenty Nine Palms) is the station pressure.

STATION PRESSURE = BAROMETER READING +- CALIBRATION CORRECTION

I quote:

Thus there are always two steps to reading and reporting a proper sea level pressure. Step one is to read the instrument and then refer to the Barometer Calibration Table to make any necessary corrections. The calibration table (or graph) provides a unique correction for each barometer reading - in that sense, it is similar to a Deviation Table for a magnetic compass.

This correction can be plus or minus. ONCE THE CORRECTION HAS BEEN APPLIED, THE RESULT IS CALLED THE STATION PRESSURE FOR THAT INSTRUMENT LOCATION.


This the reason for the ARTIFICIAL DATA YOU PROVIDED WHICH COULD NOT POSSIBLY CONTRADICT THE VERY STATEMENT MADE BY THE NATIONAL WEATHER SERVICE WHICH SAYS CLEARLY:

The most basic change in pressure is the twice daily rise and fall in due to the heating from the sun. Each day, around 4 a.m./p.m. the pressure is at its lowest and near its peak around 10 a.m./p.m. The magnitude of the daily cycle is greatest near the equator decreasing toward the poles.


Proper measurements will lead to these results:

Here is the real data on Taiwan:


http://www-das.uwyo.edu/~geerts/cwx/notes/chap01/diurnal.html

Surface pressure measurements in Taiwan (at 25 deg. N) are least around 4am and (especially) 4 pm Local Standard Time, and most around (especially) 10am, and 10pm LST; the amplitude of the semidiurnal cycle is about 1.4 hPa.


One maximum is at 10 a.m., the other at 10 p.m.; the two minima are at 4 a.m. and 4 p.m. The heating effect of the sun can explain neither the time when the maxima appear nor the time of the minima of these semidiurnal variations. If the pressure becomes lower without the air becoming lighter through a lateral expansion due to heat, this must mean that the same mass of air gravitates with changing force at different hours.